Statistical Indicators
Benchmarking the Information Society
- Statistics & indicators -
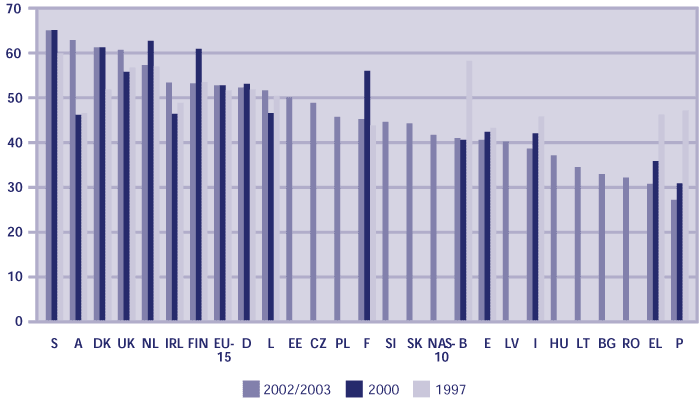
Digital divide indices for European countries

Bases: 1997, 2000: N=15,900, weighted by standard Eurobarometer country and EU-15 weights; 2002, 2003: all respondents, weighted percentages
Questions: 2002, 2003: IN1, IN3, Z19, Z21
Sources: 1997: Eurobarometer 47.0, Jan-Feb 1997; 2000: Eurobarometer 54, Oct-Nov 2000; 2002: SIBIS GPS 2002; 2003: SIBIS GPS-NAS 2003
The Digital Divide Index values for the EU Member States illustrate that a distinction can be made regarding whether, and to what extent, the digital divides for the at risk groups have improved over time. The continued persistence of relatively large digital divides in countries usually classified as late adaptors is apparent. On the other hand, the fact that some marked improvements, over a relatively short period of time, are possible has been demonstrated by the case of Austria and Ireland. Countries with an observable aggravation of divides are those ranking lower with regard to ICT uptake. The NAS countries do not lag behind very much but can be found amongst the "lower" half of EU Member States. Estonia and the Czech Republic show highest values and are not far from the EU-15 average.